by April Breyer Menon | Feb 13, 2025
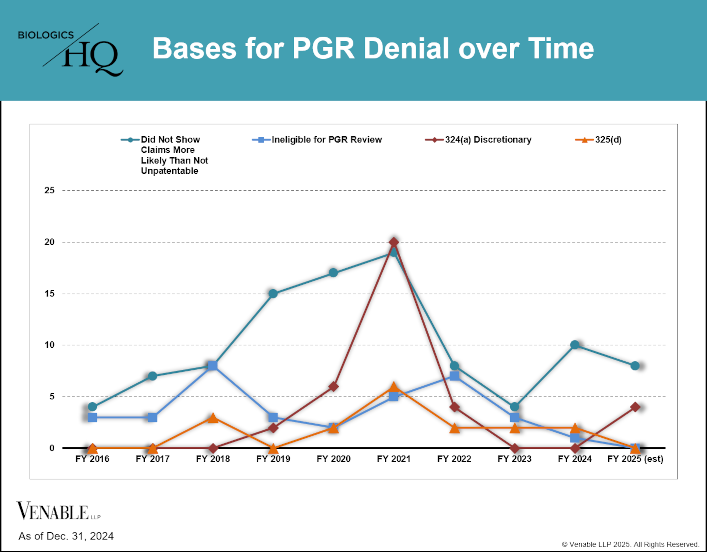
This figure shows the bases for PGR denials over time. FY 2025 estimates are calculated based on statistics from October 1, 2024 through December 31, 2024. The PTAB has increasingly denied PGR (and IPR) institutions for procedural reasons. In 2021, procedural...
by April Breyer Menon | Feb 13, 2025
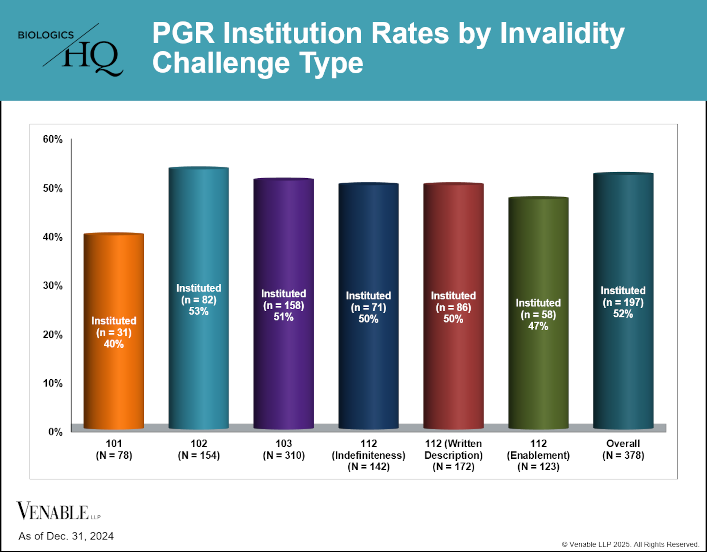
This figure shows PGR institution rates by invalidity challenge type under §§ 101, 102, 103, and 112 (indefiniteness, written description, and enablement). Where there were multiple challenge types in a petition each was reviewed separately. Infrequently...
by April Breyer Menon | Feb 13, 2025
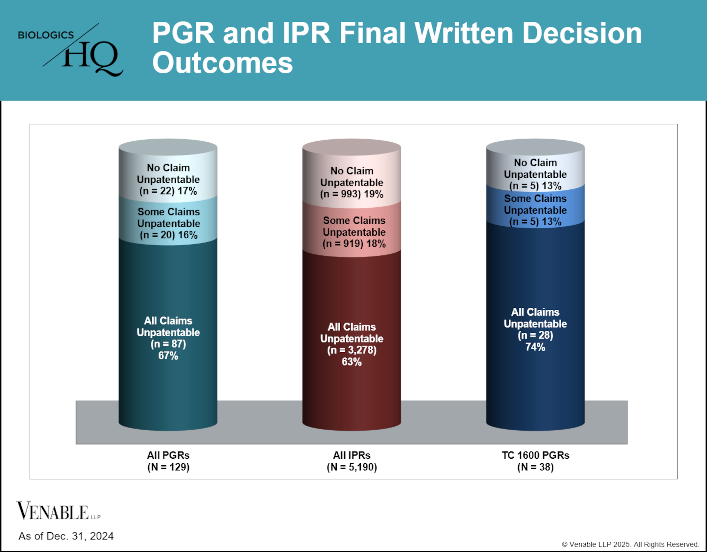
This figure shows Final Written Decision (FWD) outcomes for PGRs (N=129) and IPRs (N=5,190).[1] We also evaluated FWD outcomes for TC 1600 PGRs (N=38). The rate for FWD invalidation of all claims is similar for PGRs and IPRs, and is also relatively similar for...
by April Breyer Menon | Feb 13, 2025
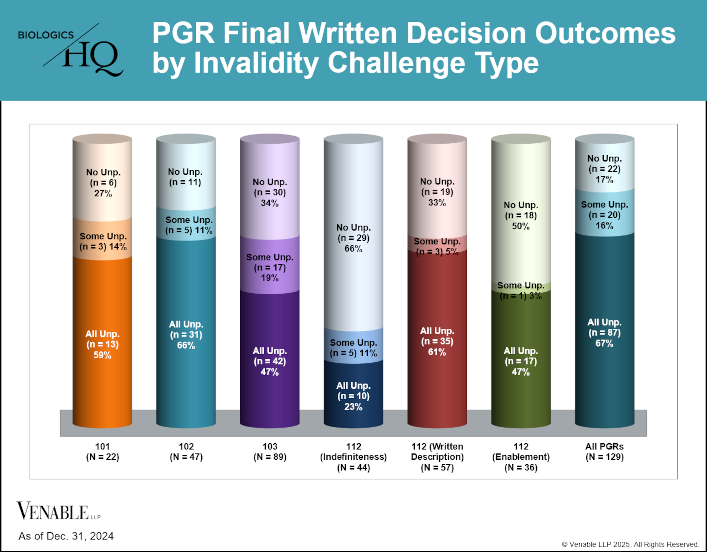
This figure shows PGR FWD outcomes by invalidity challenge type under §§ 101, 102, 103, and 112 (indefiniteness, written description, and enablement). Where there were multiple challenge types in a petition each was reviewed separately. Infrequently raised...
by April Breyer Menon | Feb 13, 2025
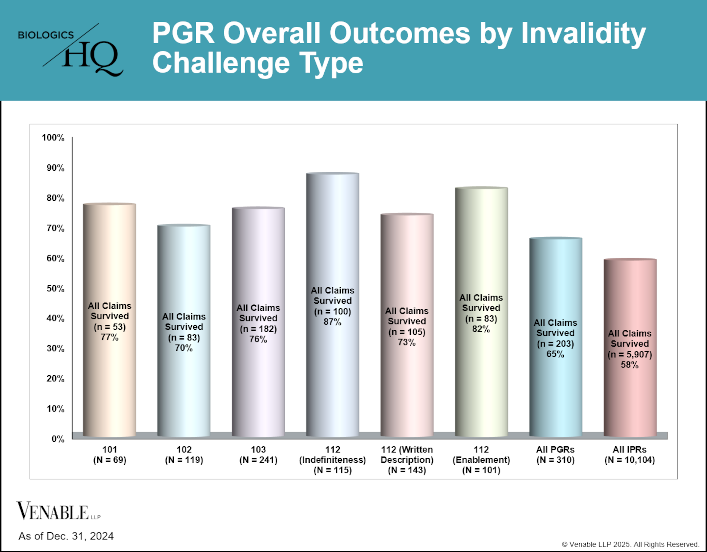
This figure shows PGR overall outcomes by invalidity challenge type. Where there were multiple challenge types in a petition each was reviewed separately. Infrequently raised challenges such as improper narrowing of dependent claims, ornamentality and...